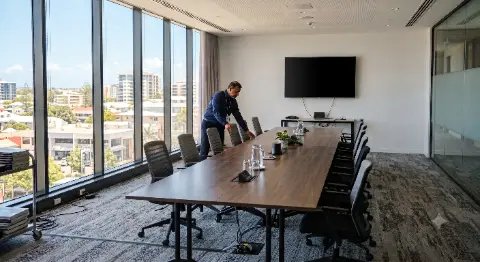
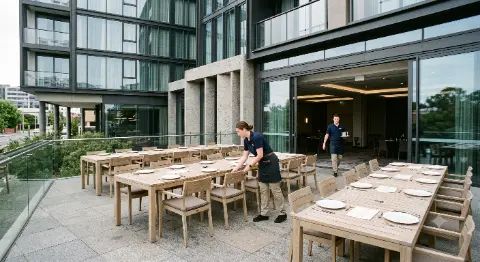
A full diary and a well-utilised venue don’t always go hand in hand.
Most operators know their busiest rooms and their quietest ones. They know which days fill without much effort, and which stretches of the calendar need work. What fewer have is a systematic way of measuring venue room utilisation. Numbers that tell them not just what's booked, but how efficiently each space is performing.
Meetings and events account for up to 50% of total revenue at many hotel properties, and across dedicated event venues the figure is higher still. Spaces that sit idle, or that are booked but running at half its capacity adds up to a significant revenue gap.
Venue room utilisation vs occupancy
Occupancy tells you whether a space is booked. Utilisation tells you how effectively it's being used, accounting for not just whether it's booked, but for how long, at what capacity, and at what rate. A room booked for three hours on a Tuesday when it could have run two back-to-back sessions, or a ballroom confirmed for 40 people when it seats 200, both show up as occupied. Neither is performing well.
Meeting & event space metrics worth tracking
Venue room utilisation rate
The percentage of available hours a space is actively in use. Most venue operators target utilisation rates in the range of 60–75%. Below 50% is a signal that something, whether pricing, marketing, configuration, or booking policy, needs attention.
Attendee density
The ratio of actual attendees to optimal capacity for the space. A boardroom set for 20 people, consistently used by groups of four, is a configuration problem worth addressing.
Revenue per available square metre (RevPASM)
Total event revenue divided by the total square meterage of the space. RevPASM is useful for comparing performance across different spaces. It shows which rooms are earning their footprint and which are underperforming relative to their size.
Booking pace and lead time
How far in advance spaces are filling, and how that pattern shifts by day of week, season, or event type. This is the data that makes forecasting possible.
No-show and cancellation rate
A space that's booked but unused still carries setup, staffing, and catering prep costs. Tracking no-show patterns by event type, client type, or time of year identifies where the risk sits and informs deposit and cancellation policy decisions.
The measurement problem most venues have
The reason utilisation data is so often incomplete for venues is because it's scattered.
Booking records live in one system. Revenue data lives in another, or in a spreadsheet, or split across accounting and events. Actual attendance figures, where they're captured at all, sit somewhere else again. Pulling all of that together into a coherent picture of how a specific room performed over a specific period is, for most venues, a manual exercise that happens quarterly at best.
Decisions about pricing, configuration, and marketing for individual spaces tend to be made on instinct rather than evidence. Experienced venue managers have a feel for their spaces and that instinct is often right. But instinct doesn't catch the slow drift of a room that was performing well eighteen months ago and has since declined, or the difference between a room that's busy and a room that's profitable.
The starting point for proper venue room utilisation tracking is having booking and revenue data in the same place, attributed to individual spaces— something venue management software handles without manual effort.
How to calculate RevPASM
RevPASM is calculated by dividing total event revenue, including room hire, F&B, AV, and ancillary charges, by the total square meterage of the space.
If a 150 square metre conference room generates $12,000 in revenue over a month, its RevPASM for that month is $80 per square metre.
The figure is most useful in comparison: against itself over time, or against other spaces in the same property. A smaller breakout room running a higher RevPASM than the main ballroom is worth investigating. It might mean the ballroom is underpriced. It might mean the configuration doesn't suit the events it's attracting. RevPASM doesn't answer those questions on its own, but it surfaces them in a way that a booking count alone won't.
One practical note: RevPASM works across indoor spaces more cleanly than outdoor ones, where the available square meterage is harder to define consistently. For outdoor event spaces, revenue per event or revenue per attendee tends to be more workable.
What low venue room utilisation means
Rooms consistently used at 20 to 30% of their seating capacity are attracting the wrong kind of event for their configuration. Options to consider are reconfiguring with modular furniture or partitioning, or actively marketing different event types into that space.
A room that fills on Thursdays and sits empty on Mondays is partly a pricing question. Dynamic pricing, which adjusts rates by day of week, season, or booking lead time, is standard practice in room revenue management and increasingly applied to event space with the help of venue management software. Static delegate day rates don't do enough to stimulate demand during quiet periods or capture full value during busy ones.
Some event types book months in advance; others book within days. A room consistently going unbooked until two or three days before the date suggests either the pricing isn't suited to late demand, or the space isn't visible in the channels where late bookings happen. A room booking out months ahead but turning away business it can't accommodate is a different problem with a different solution.
A well-configured boardroom sitting unused midweek might simply need to be in front of the corporate planners actively looking for that kind of venue space. Distribution through a venue marketplace, a direct sales push, or better search visibility is often the most direct fix for a consistently underperforming space.
Tracking room utilisation by day and time
Most venues have a predictable shape to their week: strong midweek demand for corporate bookings, softer demand at the start and end of the week, different patterns for social events at the weekend. Tracking utilisation by day of week, and by time of day where the data is available, shows where the gaps are and whether they're structural or addressable.
A room that's well-utilised Tuesday through Thursday but consistently empty on Monday mornings might fill with a targeted offer, such as a lower minimum spend or a specific package for smaller team meetings. It might also be that Monday mornings are quiet regardless of pricing, in which case the staffing and setup costs for those slots need to reflect that reality rather than be budgeted optimistically.
The pattern by time of day matters particularly for full-day venue hire and multi-session operations. A conference room running one full-day booking per day has a utilisation profile that looks identical to one running two half-day sessions, until the revenue figures are compared.
The no-show problem
A space that's booked but doesn't run still carries sunk costs: setup time, staffing, catering prep, without the corresponding revenue, or with only a partial recovery through cancellation fees. Tracking no-show rates by event type, client type, and booking lead time shows where the risk is concentrated.
Corporate bookings made well in advance tend to have low no-show rates. Last-minute bookings, speculative holds, and social events without deposits sit at the higher end. Knowing that breakdown allows deposit and cancellation policies to be calibrated to actual risk rather than applied uniformly across all booking types.
The other side of this is having a system that surfaces at-risk bookings early enough to act on them, by following up with clients whose events are approaching without confirmed final numbers or releasing tentative holds that have been sitting unconfirmed past a reasonable point.
Using utilisation data for configuration decisions
Most venues operate their rooms in a default layout and change it only when a specific event requires something different. If utilisation data shows a particular space is consistently used by small groups in a large room, or that a specific layout is repeatedly requested for a room currently configured differently, that information should be feeding into decisions about furniture, partitions, and permanent layout.
Venues that have invested in modular, reconfigurable spaces tend to see better utilisation rates because the space can serve more of the demand that comes through the door rather than turning away bookings that don't fit a fixed configuration.
What consistent tracking enables
Beyond the immediate operational decisions, consistent utilisation tracking changes what's possible at a planning level.
It makes forecasting more reliable. If a particular room runs at 70% utilisation in October and 35% in January, staffing, pricing strategy, and marketing activity can be planned accordingly rather than responding to a January dip after it's already arrived.
It makes investment decisions clearer. A venue considering whether to refurbish a space, invest in AV upgrades, or convert an underperforming room has a much stronger basis for that decision when the current performance of every space is visible and comparable.
Venue room utilisation tracking also identifies spaces that deserve more attention. A room consistently performing above its apparent potential, with higher RevPASM than its size would suggest and strong repeat bookings from a particular client segment, is worth understanding and building on.
Keep reading
Once utilisation data is in place, pricing is the next lever worth pulling.
Our guide to dynamic pricing for venues covers how to apply it across peak and off-peak periods without adding to your team's workload.